Showing posts with label D3js. Show all posts

Tuesday, May 12, 2015

d3-composite-projections

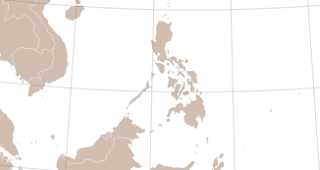
Some countries have regions sparse around the globe, which adds difficulties when drawing maps for them.
D3 already had the albersUsa projection that solved this problem by creating a composed projection, moving Alaska and Hawaii close to the main part of the USA.
But the other countries didn't have a projectino like this. That's why I made this library.

It adds the composite projection for:
With a function that draws a border between the composition zones by returning an SVG path.

There is an example for each region, linked in the list above.

The library web page explains the usage and  installation/testing

If you are going to use it, need more regions/countries or find an error, please leave a comment here.

Monday, March 30, 2015

D3js mapping presentation at Girona

Every year, SIGTE organizes workshops and a conference about Free GIS software in Girona.

This year I gave a workshop about D3js mapping.
The slides (in Spanish) are here: http://rveciana.github.io/Mapas-web-interactivos-con-D3js/
The examples can be found at my bl.ocks.org space: http://bl.ocks.org/rveciana named with the prefix JSL 2015.

Monday, July 7, 2014

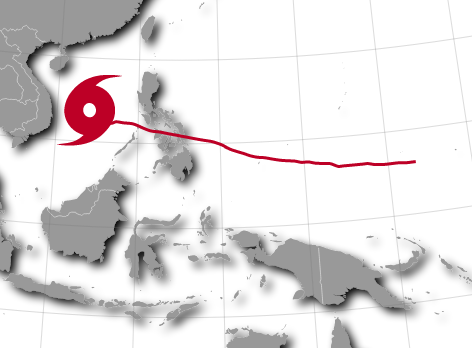
Using the D3 trail layout to draw the Hayian tracks

I wrote many examples (1, 2, 3 and 4) and some entries in the blog (1 and 2) showing how to draw animated paths on a map using the D3 library.
But since then, Benjamin Schmidt wrote a D3 layout, called trail layout, that simplifies a lot doing this kind of stuff.
Since the layout is new, and hasn't got many examples (actually, two made by the author), I'll try to show how to work with it.

The trail layout

How does the trail layout work? The author defines it as:
This is a layout function for creating paths in D3 where (unlike the native d3.svg.line() element) you need to apply specific aesthetics to each element of the line.
Basically, the input is a set of points, and the layout takes them and creates separate segments to join them. This segments can be either line or d SVG elements.

Let's see the simplest example:


    • In this case, the points are defined as an array of objects with the x and y properties. If the x and y are named this way, the layout takes them directly. If they are called for instance lon and lat, the layout must be told how to get them.
    • Line 10 creates the SVG
    • Line 14 initializes the layout. In this case, the layout is using the coordType xy, which means that as a result will give the initial and end point for each segment, convenient for drawing SVG line elements. The other option is using the coordinates value, which is convenient for drawing d elements, as we will see later.
    •  Line 15 is where the data is set and the layout is retrieved
    • The last step is where the lines are actually drawn. 
      • For each data element, the line svg is added
      • The styles are applied
      • The extremes of the line are set using the attributes x1, y1, x2, y2

    How to use coordinates as the coordType:


    The following example created the trail as a set of SVG line elements, but the trail layout has an option for creating it as a set of SVG d elements (paths).
    You can see the example here. The data, in this case, is the Hayian track. As you can see, it's quite similar as the former example, with the following differences:
    • Since in this case we are using geographical coordinates, a projection must be set, and also a d3.geo.path to convert the data into x and y positions, as usual when drawing d3 maps
    • When initializing the trail layout, coordinates must be set as the coordType.
    • Since the data elements do not store the positions with the name x and y, the layout has to be told how the retrieve them using the positioner:
      .positioner(function(d) {return [d.lon, d.lat];})
    • When drawing the trail, a path element is appended instead the line element, and the d attribute is set with the path  function defined above.

    Creating the map with the trail


    Once the basic usage of the trail layout is known, let's reproduce the Hayian path example (simplified for better understanding):


    • The map creation is as usual (explained here)
    • Lines 49 to 51 create the trail layout as in the former example
    • Line 67 creates the trail, but with some differences:
      • the beginning and the end of the line are the same point at the beginning, so the line is not drawn at this moment (lines 69 to 72)
      • The stroke colour is defined as a function of the typhoon class using the colour scale (line 75)
      • A transition is defined to create the effect of the line drawing slowly
      • The ease is defined as linear, important in this case where we join a transition for each segment.
      • The delay is set to draw one segment after the other. The time (500 ms) must be the same as the one set at duration
      • Finally, the changed values are x2 and y2, that is, the final point of the line, which are changed to their actual values
    • The complete example, with the typhoon icon and the date is also available
    It's possible to use paths instead of lines to draw the map, as in the first version. The whole code is here, but the main changes are in the last section:
    hayan_trail.enter()
          .append('path')
          .attr("d", path)
          .style("stroke-width",7)
          .attr("stroke", function(d){return color_scale(d.class);})
          .style('stroke-dasharray', function(d) {
            var node = d3.select(this).node();
            if (node.hasAttribute("d")){
              var l = d3.select(this).node().getTotalLength();
              return l + 'px, ' + l + 'px';
            }
          })
          .style('stroke-dashoffset', function(d) {
            var node = d3.select(this).node();
            if (node.hasAttribute("d"))
              return d3.select(this).node().getTotalLength() + 'px';
          })
          .transition()
          .delay(function(d,i) {return i*1000})
          .duration(1000)
          .ease("linear")
          .style('stroke-dashoffset', function(d) {
              return '0px';
          });
    • The strategy here is to change the stroke-dasharray  and stroke-dashoffset style values as in this example, and changing it later so the effect takes place.
    • At the beginning, both values are the same length as the path. This way, the path doesn't appear. The length is calculated using the JavaScript function getTotalLength
    • After the transition, the stroke-offset value will be 0, and the path is fully drawn

    Conclusion

    I recommend using the trail layout instead of the method from my old posts. It's much cleaner, fast, easy, and let's changing each segment separately.
    The only problem I find is that when the stroke width gets thicker, the angles of every segment make strange effects, because the union between them doesn't exist. 

    This didn't happen with the old method. I can't imagine how to avoid this using lines, but using the coordinates option could be solved transforming the straight lines for curved lines.

    Saturday, January 18, 2014

    D3 map Styling tutorial III: Drawing animated paths

    The example La Belle France, or the original La Bella Italia by Gregor Aisch, have a nice ferry sailing along a path to connect the islands with the continent.
    Drawing a path in a map, and animating some icon on it can be a nice tool to show information about routes, storm tracks, and other dynamic situations.
    http://bl.ocks.org/rveciana/8464690

    This example shows how to draw the Haiyan typhoon track on the map drawn in the last post.

    The working examples are here:
    Creating a geopath
    Animating an object on the path

    Getting the data

    Both the base map data and the typhoon data are explained in the post  D3 map Styling tutorial I: Preparing the data

    Creating a geopath

    First, how to draw the path line on a map. The working example is here.


    • The base map is drawn in the simplest way, as shown in this example, so the script stays clearer.
    • The typhoon track is loaded from the json file generated in the first tutorial post (line 55)
    • The path is created and inserted from lines 68 to 75:
      • A d3.svg.line element is created. This will interpolate a line between the points. An other option is to draw segments from each point, so the line is not so smooth, but the actual points are more visible. 
        • The interpolate method sets the interpolation type to be used.
        • x and y methods, set the svg coordinates to be used. In our case, we will transform the geographical coordinates using the same projection function set for the map. The coordinates transformation is done twice, one for the x and another for the y. It would be nice to do it only once.
      • The path is added to the map, using the created d3.svg.line, passing the track object as a parameter to be used by the line function. The class is set to path, so is set to a dashed red line (line 20)
    Drawing the paths is quite easy, taking only two steps.

    Animating an object on the path


    The typhoon position for every day is shown on the path, with an icon. The icon size and color change with the typhoon class. The working example is here.


    This second example is more complex than the first one:
    • The base map has a shadow effect. See the second part of the tutorial for the source.
    • The map is animated:
      • Line 135 sets an interval, so the icon and line can change with the date.
      • A variable i is set, so the array elements are used in every interval.
      • When the dates have ended, the interval is removed, so everything stays quiet. Line 158.
    • An icon moves along the path indicating the position of the typhoon
      •  Line 128 created the icon. First, I created it using inkscape, and with the xml editor that comes with it, I copied the path definition. This method can get really complex with bigger shapes.
      • Line 136 finds the position of the typhoon. The length of the track is found at line 122 with the getTotalLength() method.
      • Line 137 moves the icon. A transition is set, so the movement is continuous even thought the points are separated. The duration is the same as the interval, so when the icon has arrived at the final point, a new transformation starts to the next one.
      • Line 141 has the transform operation that sets the position (translate), the size (scale) and rotation (rotate). The factors multiplying the scale and rotation are those only to adjust the size and rotation speed. They are completely arbitrary.
    • The path gets filled when the icon has passed. I made this example to learn how to do it. Everything happens at line 144. Basically, the trick is creating a dashed line, and playing with the stroke-dashoffset attribute to set where the path has to arrive.
    • The color of the path and icon change with the typhoon class
      • At line 54, a color scale is created using the method d3.scale.quantile
        • The colors are chosen with colorbrewer, which is a set of color scales for mapping, and has a handy javascript library to set the color scales just by choosing their name. I learned how to use it with this example by Mike Bostock.
      • The lines 156 and 142 change the track and icon colours.
    • Finally, at line 154, the date is changed, with the same color as the typhoon and track.

    Links

    Simple path on a map - The first example
    Haiyan typhoon track - The second example
    D3 map Styling tutorial I: Preparing the data
    D3 map Styling tutorial II: Giving style to the base map
    Animated arabic kufic calligraphy with D3 - Animating paths using d3js
    La Bella Italia - Kartograph example by Gregor Aisch
    La Belle France - The same example as La Bella Italia, but using D3js
    Every ColorBrewer Scale - An example to learn how to use ColorBrewer with D3js

    Saturday, January 4, 2014

    D3 map Styling tutorial II: Giving style to the base map


    The example La Belle France, or the original La Bella Italia by Gregor Aisch use svg filters to give style to the maps. I haven't found many examples about how to do it, so I will explain here two different styles: a simple shadow under the map, and a style similar to the original map.

    As usual, the examples can be seen at my bl.ocks.org page:
    Drop shadow
    LaBella Italia

    SVG filters basics

    SVG can style the elements by using css or css-like attributes, like the color, the stroke, and so on. But it's possible to use filters to add efects such as blurring, dilating the shapes, adding lights... This, of course, can be used to change the map polygons too.

    A basic usage of an SVG filter is like this:


    And the result is:
    Note that:

    • The shape (a rectangle defined by the rect tag) is drawn as usual
    • The filter is defined with the filter tag inside the defs section. The filter must have an id to be used in the geometries where it has to be used
    • The filter is applied to the rectangle by using the filter="url(#blur)" attribute, where the id of the filter is added as url(#name_of_the_filter)
    This is the easiest filter an SVG can have, but filters can concatenate different effects one after the other or in parallel, as we will see in the following examples. 
    A list of all the effects and a tutorial can be found at W3C Schools

    Simple shadow

    The drop shadow effect gives a quite nice look to the maps and it's fast to process by the browser and easy to code. I took the code from this example.

    The map shown in the last post with the effect. The code:


    Note that the filter (lines 46 to 66) has several parts:

    • The filter is defined adding a defs tag and appending the filter, with an id and a height tags. The height is added to affect the region outside the geometry. It's not actually necessary in this case, but I kept it to maintain the example code.
    • An feGaussianBlur is then appended (line 50). The in attribute indicates that the input image for the filter is the alpha value of the input image, so if the map is colored in red, the shadow will remain grey. stdDeviation indicates the filter intensity, and output gives an id to use the resulting image, as we will see.
    • Line 55 adds an feOffset filter, that will move the shadow. The dx and dy attributes define how to move the shadow, but the important attribute here is the in, that takes the id defined in the feGaussianBlur tag, so what is moved is the blurred image. Again, an out attribute is defined to use the result image later.
    • Line 61 defines an feMerge tag. This is an interesting property of svg filters that allow to append different filter results one over the other to create more complex outputs. Appended to the tag, an feMergeNode is added at line 63 with the blurred image at the in attribute. At line 65, the original image is appended over the blurred image, with an other feMergeNode tag, with the in attr set to SourceGraphic to indicate the original image.
    SVG filters seemed quite dificult to me, but they are actually a kind of instructions one after the other, written in XML.

    Styling like La Bella Italia

    As it was shown in the post, the filters part of La Bella Italia map is quite complicated. I'll try to show an easy way to get a similar effect. 
    Disclaimer: In my old computer, generating these maps is very slow, so maybe it would be better to think about another combination to create cool maps without using the erode and dilate filters.

    The map without any effect looks like this:
    And the effect has three stacked parts (I'll paste only the part of the code affecting each part, the whole code is here):

    1. A colouring and blurring
      To do it:
      filter.append("feColorMatrix")
          .attr("in","SourceGraphic")
          .attr("type", "matrix")
          .attr("values", "0 0 0 0 0.6 0 0 0 0 0.5333333333333333 0 0 0 0 0.5333333333333333  0 0 0 1 0")
          .attr("result","f1coloredMask");
      filter.append("feGaussianBlur")
        .attr("in", "f1coloredMask")
        .attr("stdDeviation", 15)
        .attr("result", "f1blur");
      So there are two concatenated actions. The first one, feColorMatrix, changes the color of the original image (see how here). The second, blurs it as in the first example.
    2. Eroding, coloring, blurring and composing:
      filter.append("feColorMatrix")
          .attr("in","SourceGraphic")
          .attr("type", "matrix")
          .attr("values", "0 0 0 0 0   0 0 0 0 0   0 0 0 0 0   0 0 0 500 0")
          .attr("result","f2mask");
      filter.append("feMorphology")
          .attr("in","f2mask")
          .attr("radius","1")
          .attr("operator","erode")
          .attr("result","f2r1");
      filter.append("feGaussianBlur")
          .attr("in","f2r1")
          .attr("stdDeviation","4")
          .attr("result","f2r2");
      filter.append("feColorMatrix")
          .attr("in","f2r2")
          .attr("type", "matrix")
          .attr("values", "1 0 0 0 0.5803921568627451 0 1 0 0 0.3607843137254902 0 0 1 0 0.10588235294117647 0 0 0 -1 1")
          .attr("result","f2r3");
      filter.append("feComposite")
          .attr("operator","in")
          .attr("in","f2r3")
          .attr("in2","f2mask")
          .attr("result","f2comp");
      This one is more complicated. 
      1. The first step changes the map color into black, with an alpha value of 0.5. This output will be used in the second and last step.
      2. Then, using the first output, the image is eroded. That is, the land gets smaller by one pixel, using feMorphology with the erode operator. Then, the result is blurred using feGaussianBlur, and coloured as in the first filter.
      3. The resulting image is composited with the original black and white image, using feComposite. The definition of this operator, taken from here, is:
        The result is the part of A that is within the boundaries of B. Don't confuse the name of this attribute value with the in attribute.
    3. The two effects are stacked, and the original map is added at the end:
      var feMerge = filter.append("feMerge");
      
      feMerge.append("feMergeNode")
          .attr("in", "f1blur");
      feMerge.append("feMergeNode")
          .attr("in", "f2comp");
      feMerge.append("feMergeNode")
          .attr("in", "SourceGraphic");
      This part is simple,the feMerge stacks all the outputs indicated in the feMergeNode tags. So in this case, the blurred image goes in the first place, then the eroded one, and finally, the original one. Now, the effect seems quite a lot to the one in La Bella Italia.

    Links

    Drop shadow map - The first example
    La Bella Italia like map - The second example
    D3 map Styling tutorial I: Preparing the data - First part of the tutorial
    La Bella Italia - Kartograph example by Gregor Aisch
    La Belle France - The same example as La Bella Italia, but using D3js
    d3.js drop shadow example - SVG drop shadow filter by Charl P. Botha
    SVG filters tutorial - W3C Schools tutorial about SVG filters

    Monday, December 30, 2013

    D3 map Styling tutorial I: Preparing the data

    This is the first post of a series to explain how to draw styled maps with paths in them, using D3js.
    The final map will be an animated map of the Haiyan typhoon track:
    This entries are to explain my last post La Belle France, which had a part with filters and an other with paths, not very clearly explained.
    So first, the typhoon path data is needed, and a base map to draw under it too.

    Base Map

    To draw the maps for this tutorial, the wolrd map at 50m resolution used in most of the mbostock's examples will be used. The base map, is taken from this example, and can be seen, as usual, at bl.ocks.org.


    The basic difference from the Mercator example is the projection variable:
    var projection = d3.geo.mercator()
        .scale(5*(width + 1) / 2 / Math.PI)
        .translate([width / 2, height / 2])
        .rotate([-125, -15, 0])
        .precision(.1);

    • The scale is multoplied by five, to zoom to the typhoon zone
    • A rotation is added, to center the map to the typhoon zone

    Typhoon Haiyan track

    It's not easy to find the actual data for the hurricanes and typhoons in a convenient format. After looking into several sites, the one I like the most is this one from Japan. The data is in a list which is possible to copy, but putting all the points into an array is not an amusing activity. So here is the script I've used to transform the data into a json:
    f = open("track.txt","r")
    out = "["
    for line in f:
        day = int(line[12:16])
        hour = int(line[16:18])
        lat = float(line[20:24])
        lon = float(line[28:34])
        h_class = int(line[48:49])
    
        out += '{"day":%d, "hour":%d, "lat":%.1f, "lon":%.1f, "class": %d},' %(
            day, hour, lat, lon, h_class)
    out = out[0:-1] + "]"
    f.close()
    
    print out
    Where track.txt is the file where I pasted the data copied from the web page.

    Links

    The base map for the next posts
    La Belle France - The blog entry that made me write this post
    D3 Mercator world map example
    Haiyan typhoon track data, from the Japan Meteorological Agency Best Track Data
    Digital Typhoon in English, with tracks from many cuurent and past typhoons
    Hong Kong observatory Haiyan typhoon track data


    Tuesday, December 3, 2013

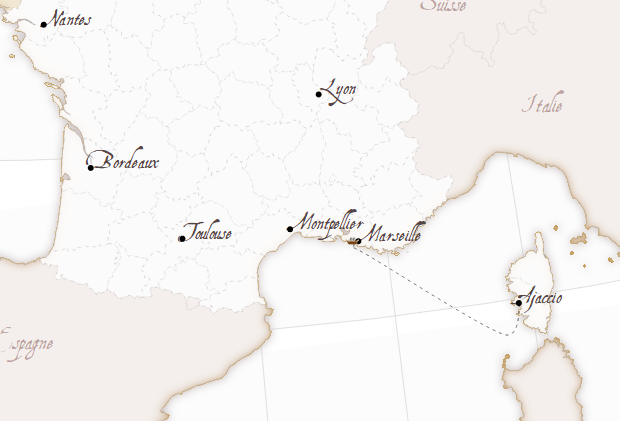
    La Belle France - Map styling with D3js

    When I looked to the vectorial web mapping tools for the first time, I was completely carried away by this example made with Kartograph by the software creator Gregor Aisch.
    This example was, actually, the reason I learned Kartograph and published some posts here.
    Later, I learned D3js, which was also amazing, but I didn't find a map like La Bella Italia. So I tried to do a similar one myself.

    See the working web 
    To make the map, I had to reproduce a the result of the Kartograph example to understand how the effects were achieved. Then, get some base data to make the map, and finally, code the example.

    Getting the data

    The map has, basically, data about the land masses, the countries and the French regions.
    I tried data from different places (one of them, Eurostat, that ended in this example), until I decided to use the Natural Earth data. After some attempts, I decided to use the 1:10m data. The files are:

    1. ne_10m_admin_0_countries.shp, clipped using:
      ogr2ogr -clipsrc -10 35 15 60 countries.shp ne_10m_admin_0_countries.shp
    2. ne_10m_admin_1_states_provinces.shp, clipped using:
      ogr2ogr -clipsrc -10 35 15 60 -where "adm0_a3 = 'FRA'" regions.shp ne_10m_admin_1_states_provinces.shp
    3. ne_10m_land.shp, downloaded from github, since the official version gave errors when converted to TopoJSON. Clipped using:
      ogr2ogr -clipsrc -10 35 15 60  land.shp ne_10m_land.shp
    With that, the land, countries and regions are available. To merge them into a single TopoJson file, I used:
    topojson -o ../data.json countries.shp regions.shp

    The html code

    Since the code is quite long, and I think that I will made some more posts about specific parts of the technique, the comments are a bit shorter than usually.

    CSS

    Note how is the font AquilineTwo.ttf  loaded:
    @font-face {
        font-family: 'AquilineTwoRegular';
        src: url('AquilineTwo-webfont.eot');
        src: url('AquilineTwo-webfont.eot?#iefix') format('embedded-opentype'),
             url('AquilineTwo-webfont.woff') format('woff'),
             url('AquilineTwo-webfont.ttf') format('truetype'),
             url('AquilineTwo-webfont.svg#AquilineTwoRegular') format('svg');
        font-weight: normal;
        font-style: normal;
    
    }
    

    Later, the font can be set using .attr("font-family","AquilineTwoRegular")

    Loading the layers

    To achieve the effects, some layers are loaded more than one time, so different filters can be applied to get the shades and blurred borders:
    svg.selectAll(".bgback")
        .data(topojson.feature(data, data.objects.land).features)
      .enter()
        .append("path")
          .attr("class", "bgback")
          .attr("d", path)
          .style("filter","url(#oglow)")
          .style("stroke", "#999")
          .style("stroke-width", 0.2);
    In this case, the land masses are drawn, applying the effect named oglow, which looks like:
    var oglow = defs.append("filter")
      .attr("id","oglow");
      oglow.append("feColorMatrix")
        .attr("in","SourceGraphic")
        .attr("type", "matrix")
        .attr("values", "0 0 0 0 0   0 0 0 0 0   0 0 0 0 0   0 0 0 1 0")
        .attr("result","mask");
      oglow.append("feMorphology")
        .attr("in","mask")
        .attr("radius","1")
        .attr("operator","dilate")
        .attr("result","mask");
      oglow.append("feColorMatrix")
        .attr("in","mask")
        .attr("type", "matrix")
        .attr("values", "0 0 0 0 0.6 0 0 0 0 0.5333333333333333 0 0 0 0 0.5333333333333333  0 0 0 1 0")
        .attr("result","r0");
      oglow.append("feGaussianBlur")
        .attr("in","r0")
        .attr("stdDeviation","4")
        .attr("result","r1");
      oglow.append("feComposite")
        .attr("operator","out")
        .attr("in","r1")
        .attr("in2","mask")
        .attr("result","comp");
    To see how svg filters work, many pages are available. I got them looking at the Kartograph example generated html.

    Adding the labels

    The labels aren't inside the TopoJSON (although they could be!), so I decided the labels to add and put them into an array:
    var cities = [ 
                    {'pos': [2.351, 48.857], 'name': 'Paris'},
                    {'pos':[5.381, 43.293], 'name': 'Marseille'},
                    {'pos':[3.878, 43.609], 'name': 'Montpellier'},
                    {'pos':[4.856, 45.756], 'name': 'Lyon'}, 
                    {'pos':[1.436, 43.602], 'name': 'Toulouse'},
                    {'pos':[-0.566, 44.841], 'name': 'Bordeaux'},
                    {'pos':[-1.553, 47.212], 'name': 'Nantes'},
                    {'pos':[8.737, 41.925], 'name': 'Ajaccio'},
                  ];
    Then, adding them to the map is easy:
    var city_labels =svg.selectAll(".city_label")
        .data(cities)
        .enter();
    
      city_labels
        .append("text")
        .attr("class", "city_label")
        .text(function(d){return d.name;})
        .attr("font-family", "AquilineTwoRegular")
        .attr("font-size", "18px")
        .attr("fill", "#544")
        .attr("x",function(d){return projection(d.pos)[0];})
        .attr("y",function(d){return projection(d.pos)[1];});
    
    
      city_labels
        .append("circle")
        .attr("r", 3)
        .attr("fill", "black")
        .attr("cx",function(d){return projection(d.pos)[0];})
        .attr("cy",function(d){return projection(d.pos)[1];});
    Note that the positions must be calculated transforming the longitude and latitude using the d3js projection functions.

    The ship

    To draw the ship, tow things are necessary, the path and the ship.
    To draw the path:
    var ferry_path = [[8.745, 41.908],
                      [8.308, 41.453],
                      [5.559, 43.043], 
                      [5.268, 43.187], 
                      [5.306, 43.289]
                      ];
      var shipPathLine = d3.svg.line()
        .interpolate("cardinal")
        .x(function(d) { return projection(d)[0]; })
        .y(function(d) { return projection(d)[1]; });
    
      var shipPath = svg.append("path")
        .attr("d",shipPathLine(ferry_path))
        .attr("stroke","#000")
        .attr("class","ferry_path");
    Basically, d3.svg.line is used to interpolate the points, making the line smoother. This is easier than the Kartograph way with geopaths, where the Bézier control points have to be calculated. d3.svg.line is amazing, more than what I thought before.
    I don't know if the way to calculate the projected points is the best one, since I do it twice for each point, which is ugly.
    To move the ship, a ship image is appended, and then moved with a setInterval:
      var shipPathEl = shipPath.node();
      var shipPathElLen = shipPathEl.getTotalLength();
    
      var pt = shipPathEl.getPointAtLength(0);
      var shipIcon = svg.append("image")
              .attr("xlink:href","ship.png")
              .attr("x", pt.x - 10)
              .attr("y", pt.y - 5.5)
              .attr("width", 15)
              .attr("height", 8);
    
      var i = 0;
      var delta = 0.05;
      var dist_ease = 0.2;
      var delta_ease = 0.9;
      setInterval(function(){
        
        pt = shipPathEl.getPointAtLength(i*shipPathElLen);
        shipIcon
          .transition()
          .ease("linear")
          .duration(1000)
          .attr("x", pt.x - 10)
          .attr("y", pt.y - 5.5);
        
        //i = i + delta;
    
        if (i < dist_ease){
          i = i + delta * ((1-delta_ease) + i*delta_ease/dist_ease);
        }else if (i > 1 - dist_ease){
          i = i + delta * (1 - ((i - (1 - dist_ease)) * (delta_ease/dist_ease)));
        }else{
          i = i + delta;
        }
        if (i+0.0001 >= 1 || i-0.0001 <= 0)
          delta = -1 * delta;
      },1000);
    The ship position is calculated every second, and moved with a d3js transition to make it smooth (calculating everything more often didn't give this smooth effect)
    The speed of the ship is changed depending on the proximity to the harbour, to a void the strange effect of the ship crashing into it. The effect is controlled by dist_ease and delta_ease parameters, that change the distance where the speed is changed, and the amount of speed changed.

    What's next

    • The SVG filters should be explained in  a better way, maybe packing them into functions as Kartograph does.
    • SVG rendering lasts quite a lot in my computer. The same happens with Kartograph, so the problem comes from the SVG rendering. Anyway, could be improved.
    • A canvas version would be nice.

    Links

    La Bella Italia -- The example I have used as a model
    Gregor Aisch's home page
    Natural Earth


    Saturday, October 5, 2013

    Castor project's earthquakes map with D3js

    The Castor project is a submarine natural gas storage facility located in front of the eastern Iberian Peninsula coast. The idea is to store the Algerian gas inside an old oilfield cavity. At least this is what I understood (sorry, geologists).
    Somehow, when the facility started working, a series of earthquakes have started to occur. At the beginning, the platform owners said it wasn't related to their activity, but now everybody agrees that it is, and the activity has stopped, but not the earthquakes.

    I didn't find a nice map about the earthquakes epicenters, so I thought that D3js would be a good option to do it.


    The star represents the aproximate platform location, and the circles, the epicenters. It's easy to see why they are related to the platform activity.


    The animated map is at my bl.ocks.org page. The explanations are in Catalan, but basically say the same as here.

    Getting the data

    The data about the significant earthquakes around Catalonia can be found at the Catalan Geologic Institute web site, but the format for the reports is not very convenient to get the data, so I made this python script to get it:

    # -*- coding: utf-8 -*-
    #http://jramosgarcia.wordpress.com/2013/10/01/que-es-el-proyecto-castor/
    import urllib
    import json
    import dateutil.parser
    import datetime
    
    def get_data(url):
        filehandle = urllib.urlopen(url)
        html = filehandle.read()
        filehandle.close()
    
        lines = html.splitlines()
    
        for i in range(len(lines)):
        
            if lines[i].find('Latitud') > 0:
                lat = lines[i].strip().split(" ")[1].replace("º","")
            if lines[i].find('Longitud') > 0:
                lon = lines[i].strip().split(" ")[1].replace("º","")   
            if lines[i].find('mol del dia') > 0:
                date = lines[i + 1].strip().replace(" >/div<","")
            if lines[i].find('Hora origen') > 0:
                hour = lines[i].strip().split(" ")[4]                   
            if lines[i].find('Magnitud') > 0:
                magnitude = lines[i+1].strip().split(" ")[0]
    
        date_array  = date.split("/")
        hour_array = hour.split(":")
    
        date_time = datetime.datetime(int(date_array[2]),int(date_array[1]),int(date_array[0]),int(hour_array[0]), int(hour_array[1]))
    
        data = {'lat':lat, 'lon':lon, 'datetime': date_time.isoformat(), 'magnitude': magnitude}
        return json.dumps(data)
    
    if __name__ == "__main__":
        url_list = [
        'http://www.igc.cat/web/gcontent/ca/sismologia/sismescomact/comhistcat/20130910175510/comact.html',
        'http://www.igc.cat/web/gcontent/ca/sismologia/sismescomact/comhistcat/20130913095842/comact.html',
        'http://www.igc.cat/web/gcontent/ca/sismologia/sismescomact/comhistcat/20130918142943/comact.html',
        'http://www.igc.cat/web/gcontent/ca/sismologia/sismescomact/comhistcat/20130920104607/comact.html',
        'http://www.igc.cat/web/gcontent/ca/sismologia/sismescomact/comhistcat/20130924091301/comact.html',
        'http://www.igc.cat/web/gcontent/ca/sismologia/sismescomact/comhistcat/20130925125029/comact.html',
        'http://www.igc.cat/web/gcontent/ca/sismologia/sismescomact/comhistcat/20130929084140/comact.html',
        'http://www.igc.cat/web/gcontent/ca/sismologia/sismescomact/comhistcat/20130929192416/comact.html',
        'http://www.igc.cat/web/gcontent/ca/sismologia/sismescomact/comhistcat/20130930005900/comact.html',
        'http://www.igc.cat/web/gcontent/ca/sismologia/sismescomact/comhistcat/20130930051316/comact.html',
        'http://www.igc.cat/web/gcontent/ca/sismologia/sismescomact/comhistcat/20131001045206/comact.html',
        'http://www.igc.cat/web/gcontent/ca/sismologia/sismescomact/comhistcat/20131001055709/comact.html',
        'http://www.igc.cat/web/gcontent/ca/sismologia/sismescomact/comhistcat/20131002121626/comact.html',
        'http://www.igc.cat/web/gcontent/ca/sismologia/sismescomact/comhistcat/20131002232928/comact.html',
        'http://www.igc.cat/web/gcontent/ca/sismologia/sismescomact/comhistcat/20131003012732/comact.html',
        'http://www.igc.cat/web/gcontent/ca/sismologia/sismescomact/comhistcat/20131003031301/comact.html',
        'http://www.igc.cat/web/gcontent/ca/sismologia/sismescomact/comhistcat/20131004113222/comact.html',
        'http://www.igc.cat/web/gcontent/ca/sismologia/sismescomact/comhistcat/20131004120323/comact.html'
        ]
    
        f = open("data.json","w")
        f.write("[")
        json_data = ""
        for url in url_list:
         json_data = json_data + get_data( url ) + ", "
           
        f.write(json_data[0:-2])
        f.write("]")
        f.close()


    • The web pages are in the list, since the interesting reports have to be chosen one by one. It would be nice to have a better way to do it.
    • Then, the get_data function just parses the text in the way that all the reports are parsed properly.The data is stored in a json file to make easier it's use from D3js.

    Using D3js to visualize the data

    I used this example by Mike Bostock to create the background  map. The tiles origin has been changed because the example tiles are not available at this zoom level, and to have more points of interest to situate the earthquake locations.

    This is the code:


    <script>
    /**
    Based on Mike Bostock's http://bl.ocks.org/mbostock/4150951
    */
    var width = 960,
        height = 500;
    
    var projection = d3.geo.mercator()
        .center([0.5491, 40.4942])
        .scale(20000);
    
    var path = d3.geo.path()
        .projection(projection);
    
    var tile = d3.geo.tile()
        .scale(projection.scale() * 2 * Math.PI)
        .translate(projection([0, 0]))
        .zoomDelta((window.devicePixelRatio || 1) - .5);
    
    var svg = d3.select("body").append("svg")
        .attr("width", width)
        .attr("height", height);
    
      var tiles = tile();
    
      var defs = svg.append("defs");
    
    var magnitudeScale = d3.scale.linear().domain([2,5]).range([5,30]);
    d3.json("data.json", function(error, locations) {
    
      svg.append("g")
          
        .selectAll("image")
          .data(tiles)
        .enter().append("image")
          .attr("xlink:href", function(d) { return "http://" + ["a", "b", "c", "d"][Math.random() * 4 | 0] + ".tiles.mapbox.com/v3/examples.map-vyofok3q/" + d[2] + "/" + d[0] + "/" + d[1] + ".png"; })
          .attr("width", Math.round(tiles.scale) + 1)
          .attr("height", Math.round(tiles.scale) + 1)
          .attr("x", function(d) { return Math.round((d[0] + tiles.translate[0]) * tiles.scale); })
          .attr("y", function(d) { return Math.round((d[1] + tiles.translate[1]) * tiles.scale); });
    
      svg.append("g")
          .append('path')
          .attr("d","m 0,0 -8.47858,-5.22254 -8.31623,5.47756 2.34696,-9.67752 -7.77927,-6.21653 9.92909,-0.75852 3.50829,-9.31953 3.78972,9.20873 9.94748,0.45679 -7.58687,6.44982 z")
          .attr("stroke","black")
          .attr("stroke-width",2)
          .style("fill", d3.rgb(90, 90, 90))
          .attr("transform", "translate("+projection([0.66879, 40.33503])[0]+","+projection([0.66879, 40.33503])[1]+")");
      
      var locationsG = svg.append("g");
      
    
      function addLocation(loc){
        locationsG.append('circle')
          .attr('class','location')
          .attr("r", 5)
          .attr("cx", projection([loc.lon, loc.lat])[0])
          .attr("cy", projection([loc.lon, loc.lat])[1])
          .style("fill", d3.rgb(255, 0, 0).darker(2))
          .style("opacity", 0.8)
          .transition()
          .duration(1000)
          .attr("r", magnitudeScale(loc.magnitude))
          .transition()
          .delay(2000)
          .duration(2000)
          .style("opacity",0.3);
    
        locationsG
          .append("text")
          .text(loc.magnitude)
          .attr("x", projection([loc.lon, loc.lat])[0] - 10)
          .attr("y", projection([loc.lon, loc.lat])[1] + 5)
          .attr("font-family", "sans-serif")
          .attr("font-size", "12px")
          .attr("fill", "black")
          .style("opacity",0)
          .transition()
          .duration(1000)
          .style("opacity",1)
          .transition()
          .delay(2000)
          .duration(2000)
          .style("opacity",0);
      }
    
      //addLocation({"lat": "40.43", "magnitude": "2.7", "lon": "0.7", "datetime": "2013-10-09T06:43:16"});
      
      var intDate = new Date("2013-09-10T00:00:00Z");
      var maxDate = new Date("2013-10-04T00:00:00Z");
      var usedLocations = new Array();
    
      var dateTitle = svg
        .append("text")
        .attr("id", "dataTitle")
        .text(intDate.toLocaleDateString())
        .attr("x", 70)
        .attr("y", 20)
        .attr("font-family", "sans-serif")
        .attr("font-size", "20px")
        .attr("fill", "black");
    
      var interval = setInterval(function() {
    
        dateTitle.text(intDate.toLocaleDateString());
    
        for (i = 0; imaxDate){
            clearInterval(interval);
          }
    
        }
        
        intDate.setDate(intDate.getDate() + 1);
      }, 1000);
      
    });


    •  Lines 30 and 48 are the most important ones to create the tile map. In this case, no zoom or pan is set, so the code is quite simple.
    • The line 57 creates the star indicating the platform location. I made the star using Inkscape and captured the code using the tool to see the generated svg. To situate the symbol on the map, a transform attribute is used, translating the symbol to the pixel calculated projecting the location coordinates.
    • To add the earthquake epicenters:
      • The function addLocation (line 68) adds the circle and the text indicating the earthquake magnitude. To locate them, the projection function is used again. Two transitions are used to make the circle grow and then get brighter. The same for making the text disappear.
      • An interval is created (line 118) to change the date (one day per second). For every iteration, the date is evaluated and the earthquakes occured during this day plotted using the addLocation function. I didn't find a "more D3js" solution. The earthquakes already plotted are stored in an array to avoid plotting them more than once.
        The date on the map is also changed for every iteration.

    Some related posts and pages:

    Wednesday, August 28, 2013

    Flag map with D3js

     In this example I'll show how to draw a map filling the polygons with images. In this case, Western Africa contries filled with their flags:

    The zone represented is this one:

    As usual, you can get all the code at GitHub:


    Canvas

    The code basically uses Mike Bostock's queue.js to download all the flag images from the wikipedia, the world borders and the contries names. Once everyting is donwloaded, a function is triggered, that draws the flags, clipping them by the country shape. The first version is written using Canvas instead of SVG, just to see how the clipping and loading of external images is done.

    The code:


    • I make an array with all the image locations, indexing by name to make it easier to understand, even though the map file doesn't contain names but indexes.
    • Lines 37 to 47 configure the map projection and the Canvas element.
    • Lines 54 to 77 load all the elements. Since loading an image is not a function in D3js, a custom function has to be created, returning the error or the success value. If images are not preloaded, the code will try to paste them anyway, so the country flag won't be drawn
    • Function ready is triggered when everything is loaded, and it actually draws the map.
      • The error is handled at the first lines (very poorly, I know, a nodata image could be loaded, or something like that)
      • Until line 97, the base map is loaded (the land gets hidden later by the flags).
      • Lines 100 to 109 get the countries from the list, looks for them in the countries file by using a filter function and creates the images we are going to use later.
      • At line 111, all the flags are pasted on the map.
        • context.save();  Saves what has been drawn until the moment, so new things can happen
        • Then, the country border is drawn in a path, without using any color or fill, because then, context.clip(); is called to use this path as the clip path.
        • The image is pasted, using the drawImage method. The bounds are recalculated before for the countries that appera cut at the map.
        • context.restore(); frees the clipping.
      • Finally, at line 130, the borders are drawn to make the map prettier.

    SVG

    The SVG version is simplier, because no image preloading is needed, since the svg contains only the image source, and the browser will draw it when the image loads.


    • The code is almost the same, just that it doesn't preload the images with queue.js
    • Obviously, the canvas tag is replaced by SVG, and to draw, the usual SVG mode is used.
    • To clip, a clipPath is defined with the country shape and an id, so it can be assigned to an image. 
    • The image is added using an image tag
      • xlink:href sets the image link
      • clip-path sets the path used to clip the image
      • preserveAspectRatio has to be set as none, so the image ratio can be changed to make the flag fit the bounding box.

    Notes:

    To preload images using queue.js I asked this question at StackOverflow, kindly
    answered by explunit.

    Wednesday, August 14, 2013

    Representing population density with D3js


    Choropleth maps represent variables colouring (or filling with a pattern) areas in the map.
    We were discussing a map with the local OGGeo group in Barcelona, and we all noticed that it had a problem.
    The map was about the percentage of people in Catalonia whose home language was Catalan.It showed most of the areas coloured as mostly Catalan-speakers zone, but since the greatest share of the population in Catalonia is around the city of Barcelona, where Spanish is more spoken as primary language, the map could give a wrong impression to people that didn't know the population distribution in Catalonia.

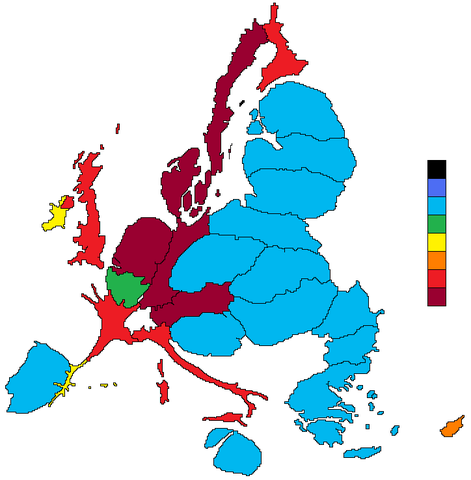
    Cartograms are thought to solve this problem, but the author of the map didn't like them, because if the population is very unevenly distributed, the result is really difficult to understand
    Map taken from the Wikipedia's cartogram entry

    So I tried a pair of things to see if the result was better. The examples code are in a GIST at GitHUB, so they can be visualized at http://bl.ocks.org:

    Resizing polygons according to the population density

    Every comarca (the regions Catalonia is divided in) is coloured according to the percentage of people able to speak Catalan (yes, I couldn't find the number of people who has Catalan as their first language). When the button is pressed, the coloured polygons shrink according to the population density of the region:
    The only comarca that stays with the same size is Barcelonès, since is the one with the highest population density. You can see that the dark-green zones are low populated, so they shrink a lot.
    It's very difficult to me to see the color when the polygon gets too small, even though I didn't shrink them linearly, but smoothing it with a square root, so I think that it's not the best solution.
    Since the code is very similar to the one at Mike Bostok's example I won't comment it.

    Filling with points according to the population density

    This example at Kartograph web page gave me the idea for the second example, although I changed it a little using colors.
     In this case, every polygon is filled with circles. The color of the circle represents the magnitude we are showing (% of people able to speak Catalan, in this case), and the size represents the population density.
    I think that the result is clearer in this case. The separation between circles and the maximum circle radius can be adjusted to get better results.
    I will comment the code, since I had to write it from the scratch.

    Basically, for each polygon, the bounding box is calculated, and the region filled with dots. Then, the polygon is used to clip the rectangle of circles.

    Point density according to the population density


    •  The first lines set the pointSeparation and maxPointSize and set the color scale.
    • Lines 20 to 31 set the projection and the SVG element.
    • Lines 32 to 47 get the data about the number of speakers and population, and set the maximum and minimum values to be able to adjust colors and circle sizes.
    • Line 49 sets the color scale
    • Lines 53 to 60 sets the masks for each polygon by appending a clipPath
    • Then, from 63 to 69, the points are drawn by calling the function draw_circles for each polygon. To call the function, the each method is used. The clip-path attribute links the masks set before.
    • Lines 74 to 93 contain the function draw circles.
      • The bounding box and centroid are nneded. The first one to get the width and height, and the second to move it at he region center.
      • Once the size is set, the grid is drawn with the two loops
    • lines 95 to 100 draw the borders
    • lines 102 to 120 draw the legend.

    Notes

    I created a GIST to store all the data for both examples, since It's easier to re-use it.